Research & Development
Improving the earthquake hypocenter determination using “hypo TD”
Displaying the JMA unified hypocenter in 3D using an innovative relative hypocenter determination method "hypoTD"
 Published: May 27, 2024
Improving the accuracy of earthquake hypocenter determination
Accurate determination of earthquake hypocenters (the point inside the Earth where the earthquake originates) is challenging due to the complex and varied underground structures. One widely used method for determining hypocenters is "hypoDD" developed by Waldhauser & Ellsworth (2000). This technique calculates hypocenters by analyzing the differences in arrival times of seismic waves from earthquakes across a relatively large area, helping to reduce errors caused by underground heterogeneity.
Despite its strengths, "hypoDD" has several limitations:
- 1.It is not suitable for determination of earthquake that occur over too wide area.
- 2.It is challenging to incorporate new earthquake data regularly.
- 3.The results can vary depending on the choice of the damping constant used in the calculations.
Automatic Earthquake Hypocenter Determination System
Horiuchi Shigeki and his team at Home Seismometer Co., Ltd. have developed a new automatic hypocenter determination system called "hypoTD*". This system uses a large database of template earthquakes to accurately determine epicenters. Since 2002, "hypoTD*" has processed over 4.1 million hypocenters and features a 3D visualization tool accessible through a web browser.
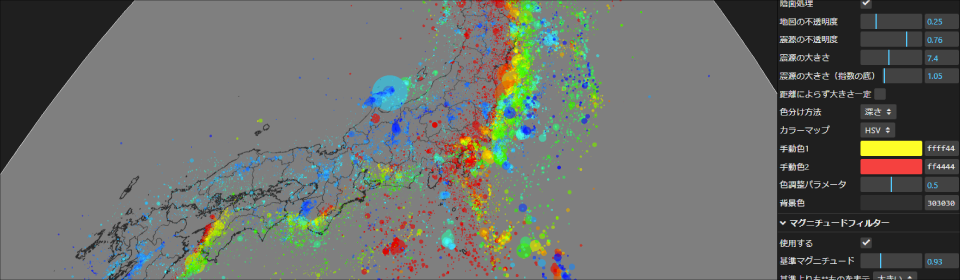
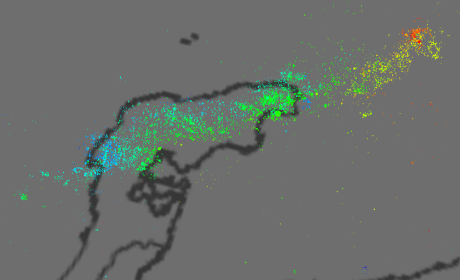
This tool allows users to view earthquake epicenters for any selected time period from any angle, providing a comprehensive 3D view of the earthquake distribution across Japan. It also enables detailed visualization of specific earthquakes, such as the Noto Peninsula earthquake in January 2024, where the 3D view shows the earthquake along a northwest-dipping plane.
Noto Peninsula (2023-2024) View from above

Noto Peninsula (2023-2024) View from underground
*For more details on the "hypoTD" method, visit Home Seismometer Co., Ltd..
https://www.homeseismo.com/html/download_hypo.html
3D Visualization with "hypoTD"
Our web-based tool displays the distribution of earthquake hypocenter across Japan for the past 22 years. You can explore this data in 3D from any angle or scale. The hypocenter data is based on the "hypoTD" method and has been cross-verified with the Japan Meteorological Agency’s unified hypocenter data.
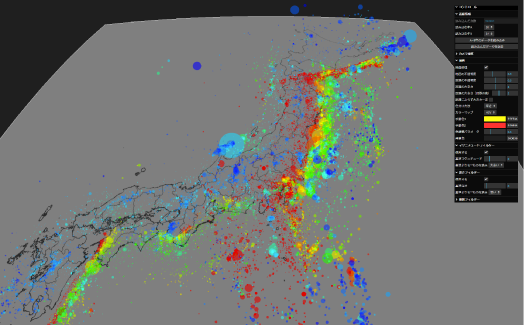
- 1.Set the Period Enter your desired time frame (from year A to year B) in the "hypocenter information" panel on the right side of the screen and click the "Load data from years A to B" button.
- 2.Change the perspective
Left drag: Move the view position.
Right drag: Rotate the view angle.
Scroll: Zoom in or out
View the 3D Visualization tool
[How to use the 3D Visualization Tool]
*English version is currently under development.